Kubernetes Monitoring with kube-prometheus-stack


Introduction
You have stepped into the Kubernetes world, you have a shiny new cluster and created your Helm charts and deployed them. Suddenly, you realize some of your pods were restarting. There is nothing in the pod logs, and you don't know the problem. At this point, Prometheus will come to help.
Personally, I install the monitoring stack just after cluster creation. Monitoring stack is a lifesaver when you have trouble with your cluster.
In this article, I'll explain how the Kubernetes monitoring stack (kube-prometheus-stack) is installed.
Requirements
Installation
There are different ways to install Prometheus in your host or in your Kubernetes cluster:
- As a single binary running on your hosts, which is fine for learning, testing, and developing purposes but is not appropriate for a containerized deployment.
- As a Docker container which has, in turn, several orchestration options: Raw Docker containers, Kubernetes Deployments / StatefulSets, the Helm Kubernetes package manager, Kubernetes operators, etc.
We'll follow to Helm installation (Operator) procedure.
The Prometheus community is maintaining a Helm chart that makes it really easy to install and configure Prometheus and the different applications that form the ecosystem.
To install Prometheus in your Kubernetes cluster with Helm just run the following commands
kubectl create namespace monitoring
helm repo add prometheus-community https://prometheus-community.github.io/helm-charts
helm repo update
After updating the helm repo, run the following command
helm install prometheus prometheus-community/kube-prometheus-stackBy default, this chart installs additional, dependent charts:
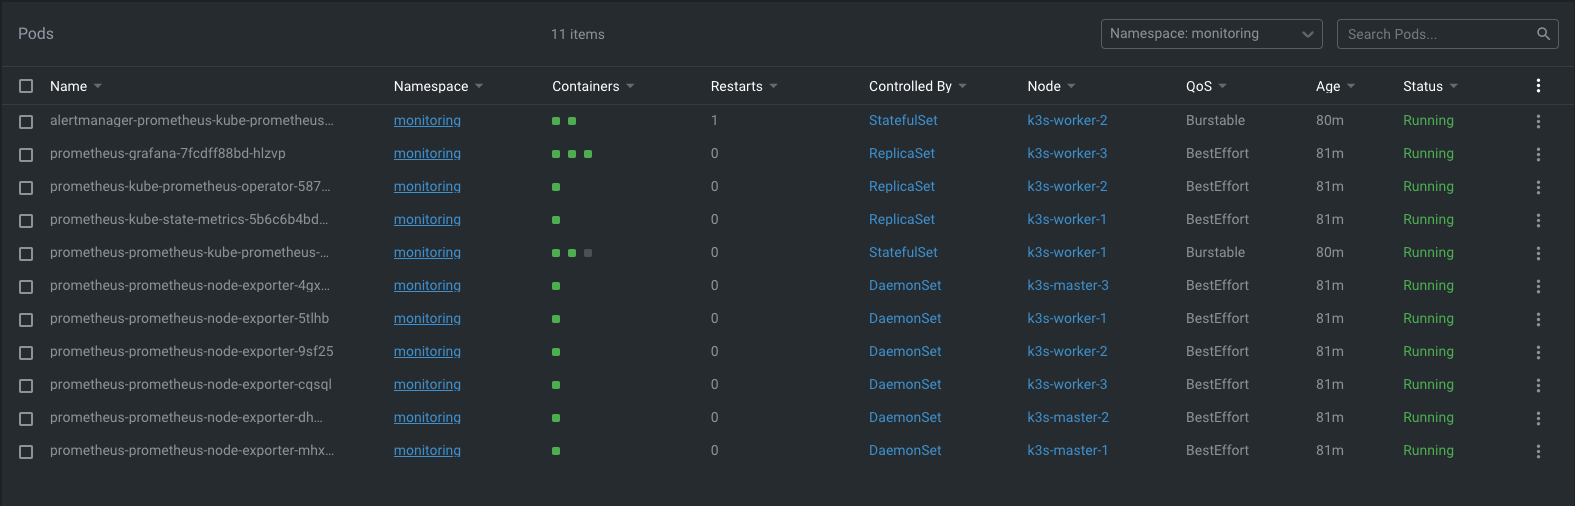
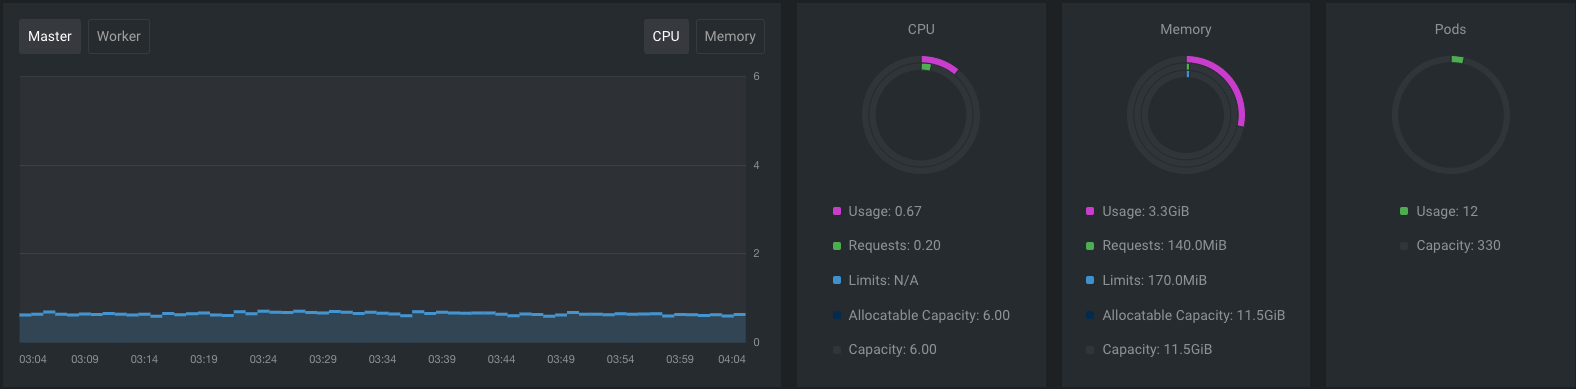
If you are using Lens IDE you can see metrics from the cluster dashboard.
Configure Grafana
In order to reach Grafana Dashboard, we need to do port-forward.
kubectl port-forward services/prometheus-grafana 3000:80Additionally, we need to grab Grafana's username and password.
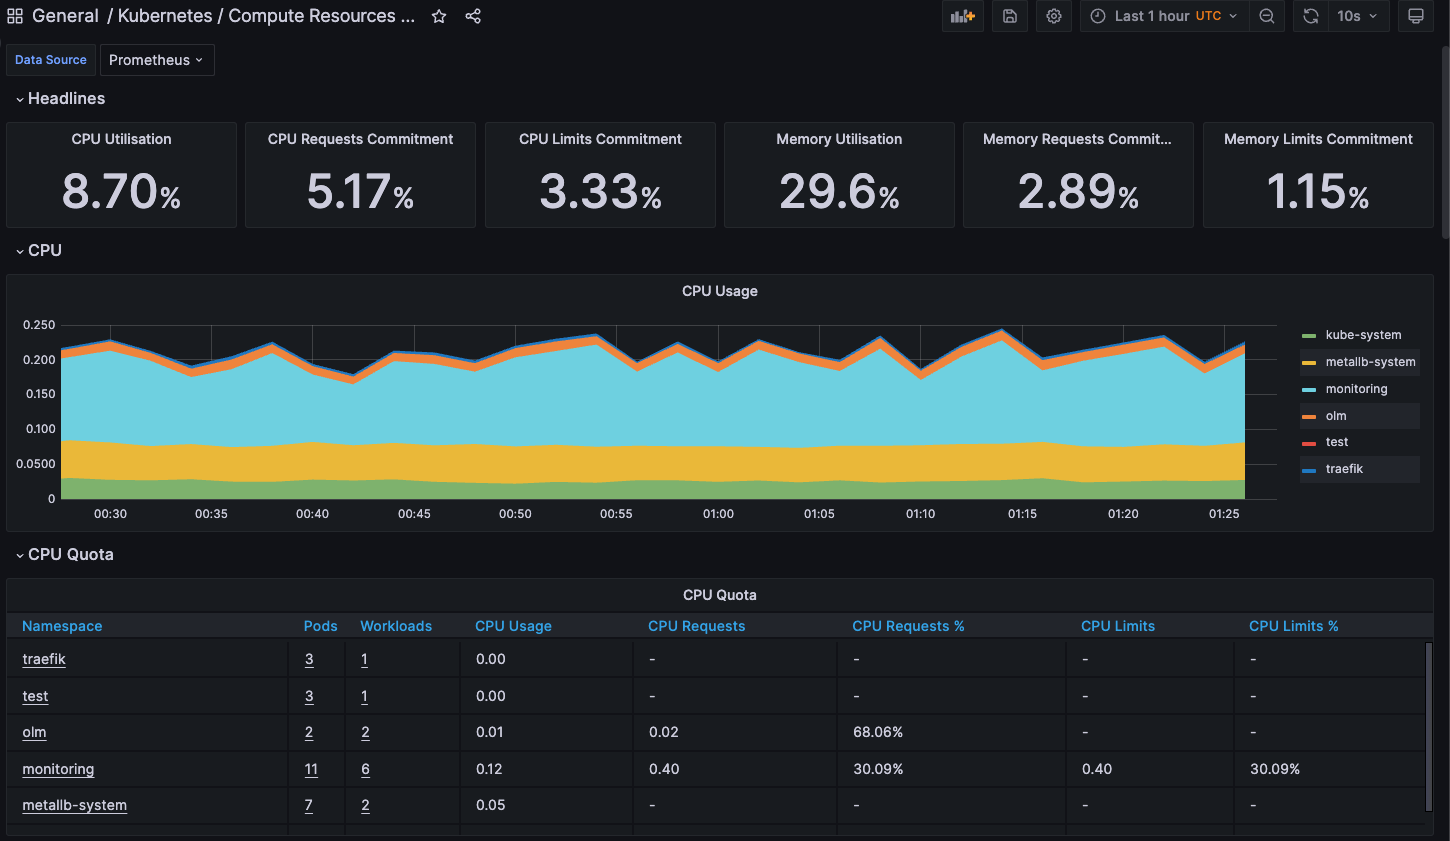
kubectl get secret -n monitoring prometheus-grafana -o json | jq '.data | map_values(@base64d)'Now, we can log in to the Grafana dashboard and import the sample dashboard. In order to do that
Left Menu -> Dashboards -> New -> Import
Sample Dashboard: https://grafana.com/grafana/dashboards/6336-kubernetes-pods-prometheus/
Select Datasource to Prometheus and click Create.
Result
We have installed monitoring, which is an indispensable part of the Cloud Native world. With this setup, you can track both Kubernetes & pods metrics, also you can define thresholds and send notifications thanks to the alertmanager.
See you in the next article. 👻


