K8S Monitoring, Application Debug with Pixie


Introduction
I have been working professionally in the software industry for about 15 years. I have had the opportunity to work with many different tools in different companies, such as Appdynamics, Dynatrace, New Relic, Datadog etc. Thanks to these applications, we can observe our application performance metrics, traces and bottlenecks. Today I will explain to you how to set up and manage another observability tool (plus it's open-source), Pixie!
What is Pixie?
Pixie is an open-source observability tool for Kubernetes applications. Pixie uses eBPF to automatically capture telemetry data without the need for manual instrumentation.
Thanks to Pixie we can view the high-level state of our clusters.
- service maps
- cluster resources
- application traffic and more
Also drill down into more detailed views (pod state, flame graphs, individual full body application requests etc)
Pixie automatically collects the following data:
- Protocol traces
- Resource metrics
- Network metrics
- JVM metrics
- Application CPU profiles
Install
To set up Pixie, you need to sign up first. After account creation, you need to log in with the px auth login command and decide on the installation method. You can install Pixie via CLI, Helm or Yaml. I'll go with CLI.
bash -c "$(curl -fsSL https://withpixie.ai/install.sh)"or
brew install pixie
Deploy
Pixie is using Operator Framework, which is another important point for the deployment. If you already have it you need to add some flag to the install command.
No OLM present on the cluster:
px deployOLM already exists on the cluster:
px deploy --deploy_olm=falseAfter the deploy command is executed, Pixie will create 3 following namespace:
- olm
- pl
- px-operator
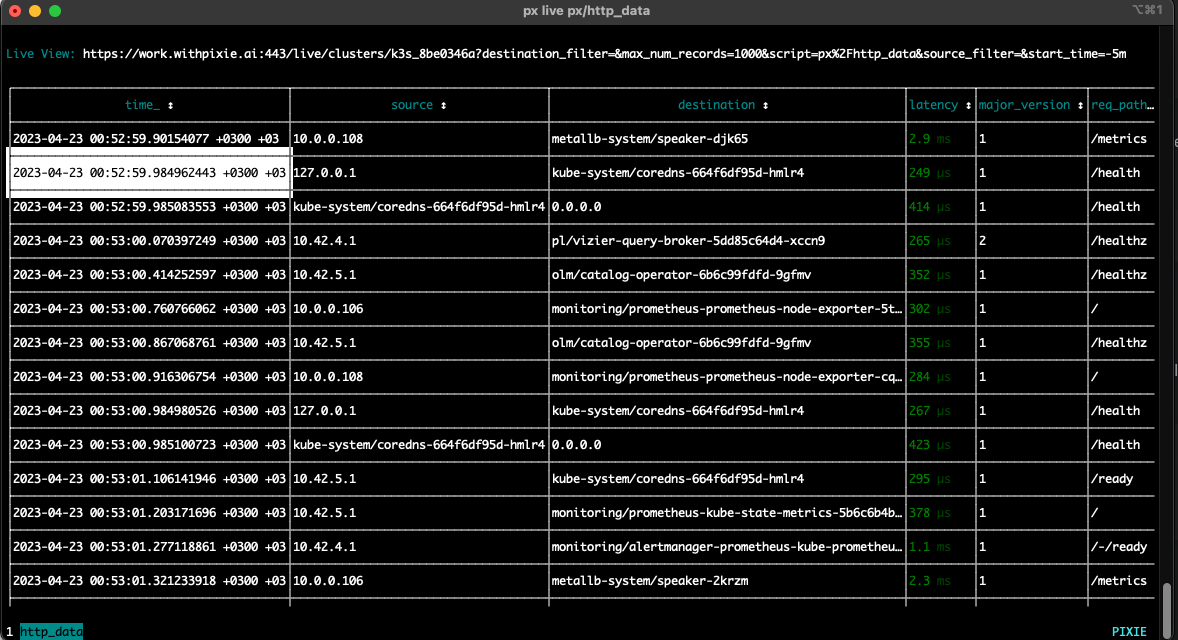
For a quick test after a successful deployment, you can run the command below
px live px/http_dataThis pre-defined command will give you detail about HTTP data.
If you wonder about all script lists, you can execute the following script:
px scripts listWeb GUI
Thanks to the Web UI, you can get live information about your cluster and applications.
Before starting, you can access all the scripts that you can access with the CLI by selecting the namespace, also via the UI.
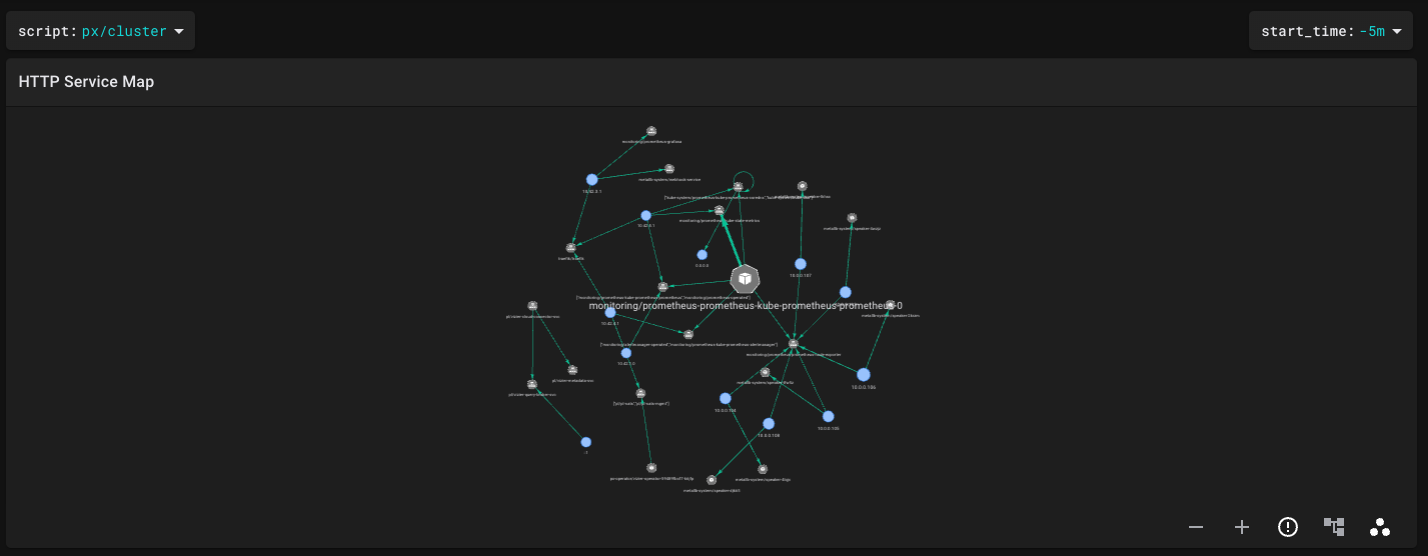
Service Map:
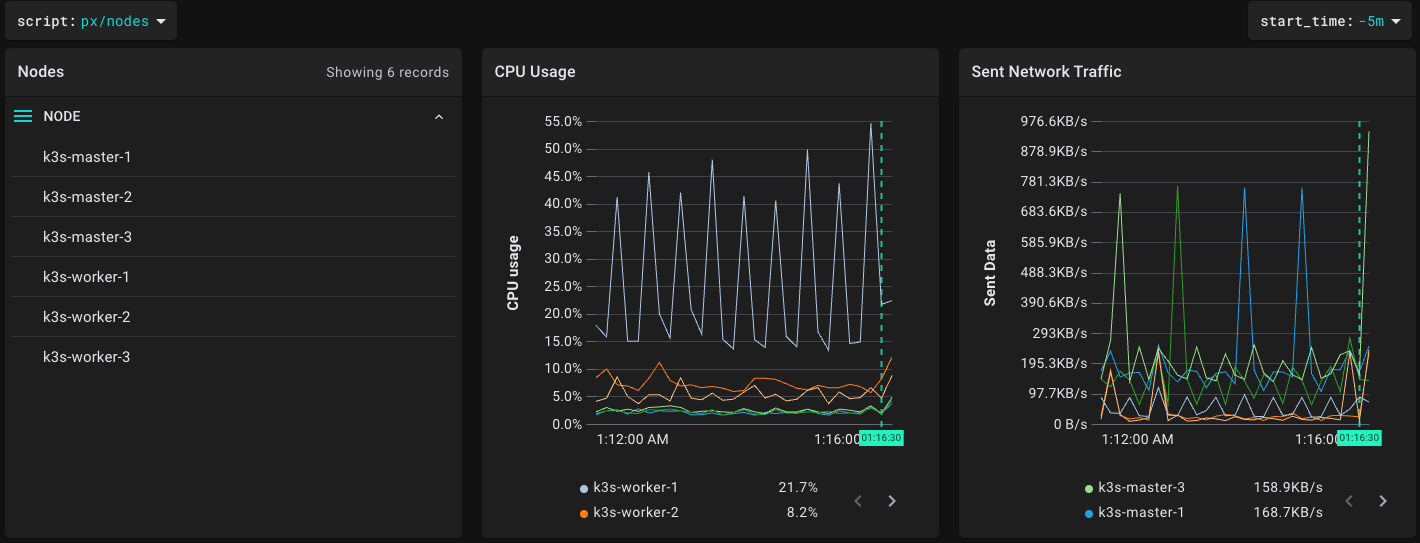
K8S Nodes:
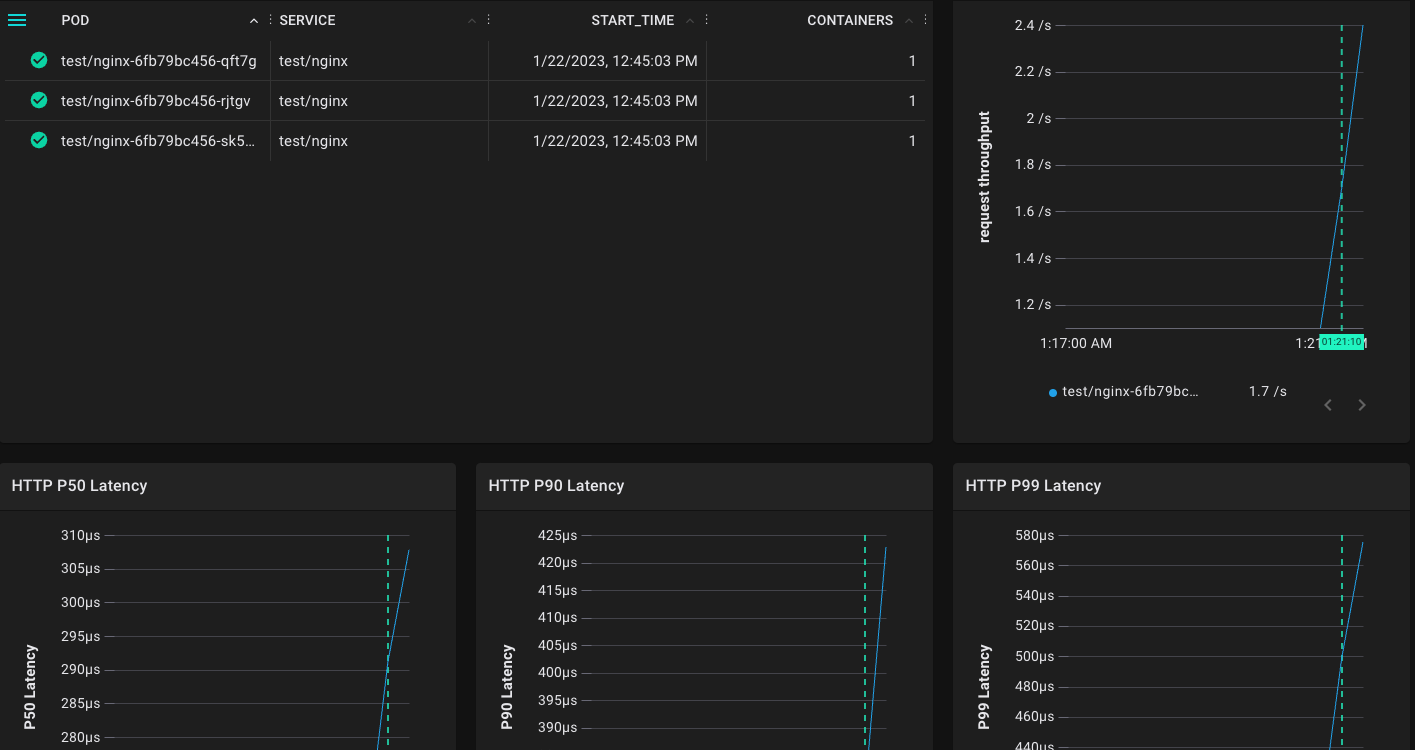
Pods:
Also, you can find about JVM, the slowest SQL queries in your dashboard.
Conclusion
In this article, we learned how to install Pixie and the basic commands. Now we can access more information about our applications and take precautions by observing before problems arise.
See you in the next article. 👻


