EC2 Disk Usage Monitoring with CloudWatch


Introduction
Monitoring disk usage is crucial, especially in production systems. Maybe you realise, you can not find metrics indicating the disk usage in Cloudwatch. Let's solve this problem with Cloudwatch Agent!
Create IAM Role
In order to start the process, you need to grant your EC2 access to the CloudWatch service. To do so, we need to create a new Role from IAM Service.
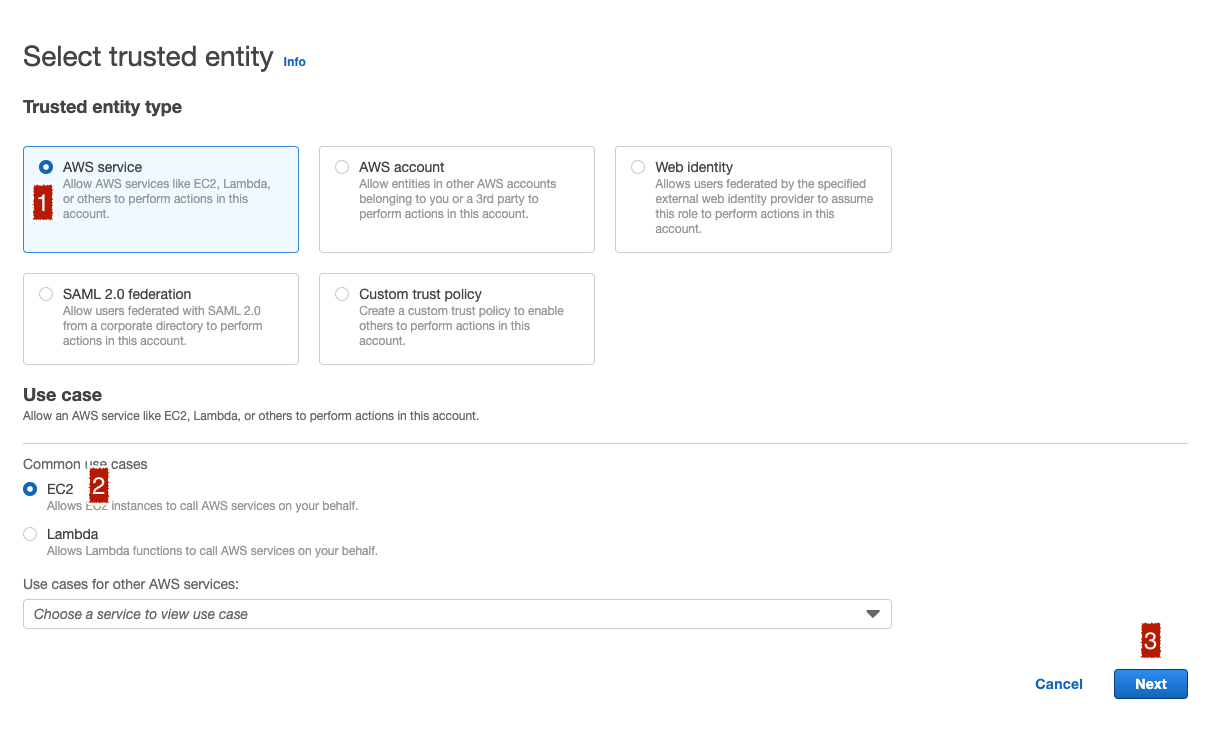
Client Create Role button, Select AWS service, EC2 and click Next:
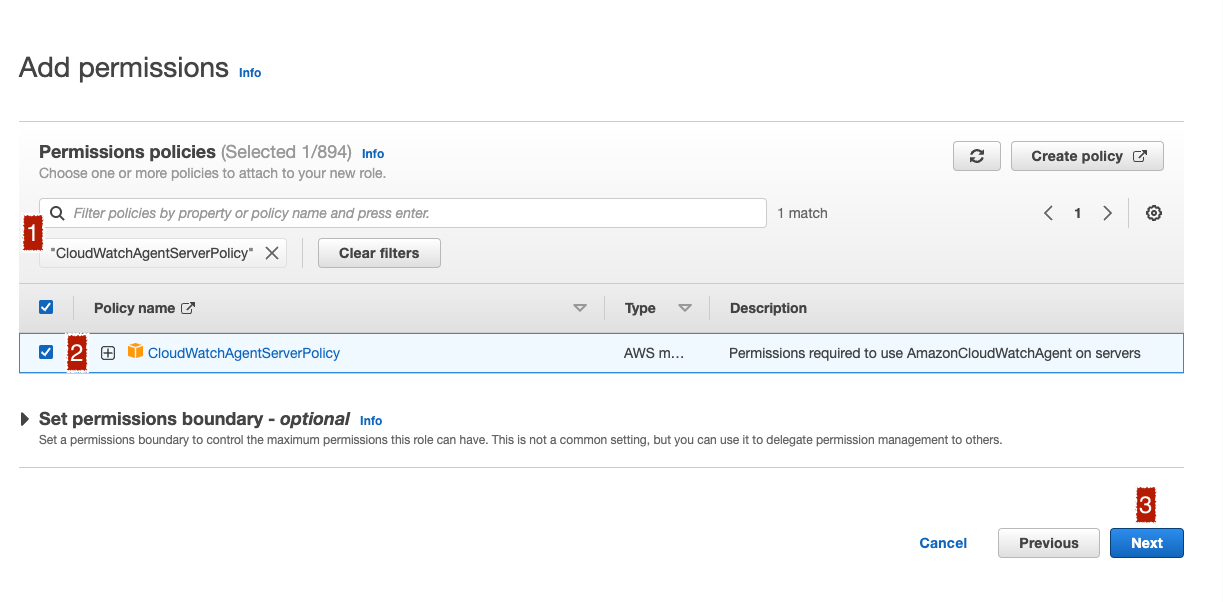
Search CloudWatchAgentServerPolicy and select CloudWatchAgentServerPolicy from the result list. Click the Next button to proceed.
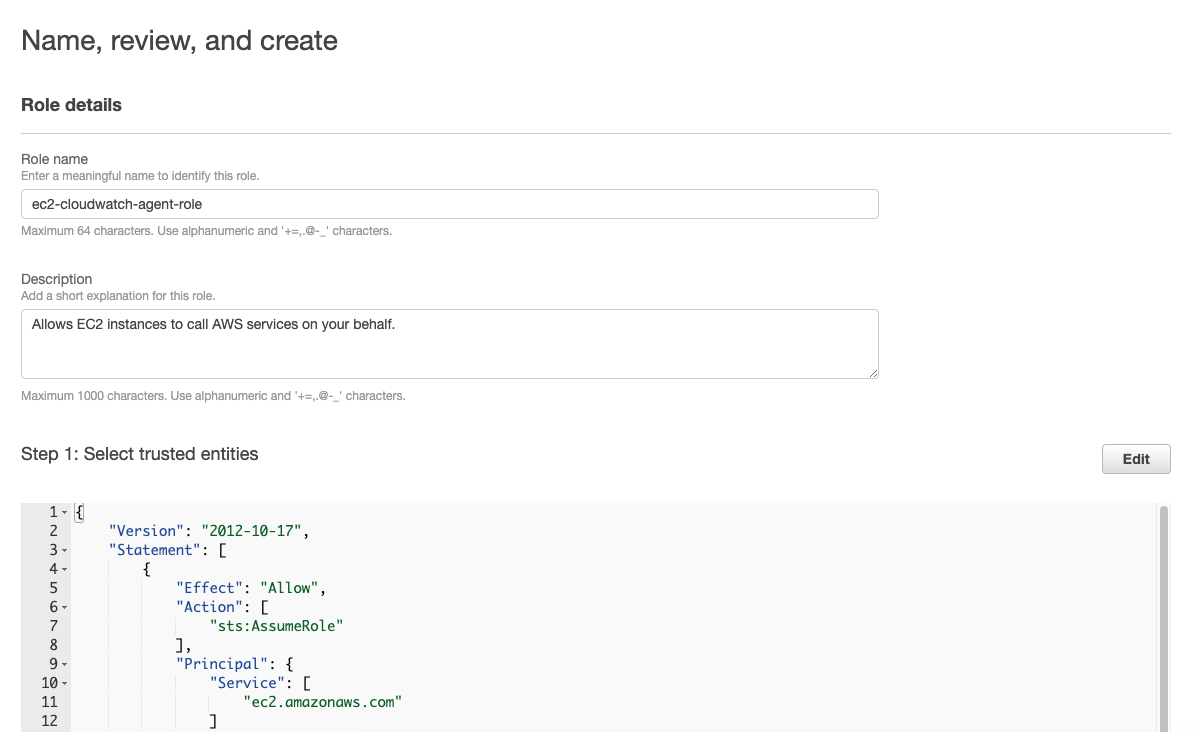
In the next screen, type in a name for the role and click Create. I name it as ec2-cloudwatch-agent-role.
Attach Role to EC2
To change EC2 Role, you need to find your instance and select Actions -> Security -> Modify IAM Role. Select the previously created role and click the Update IAM Role button.
Install Agent
I'm using Debian for this, if you are using another distro, you can find more detail from here.
cd ~
wget https://s3.amazonaws.com/amazoncloudwatch-agent/debian/amd64/latest/amazon-cloudwatch-agent.deb
dpkg -i amazon-cloudwatch-agent.deb
Configure Agent
The following config is needed for disk usage. In order to configure we need to edit the config file.
nano /opt/aws/amazon-cloudwatch-agent/etc/amazon-cloudwatch-agent.json
{
  "agent": {
    "metrics_collection_interval": 60,
    "run_as_user": "cwagent"
  },
  "metrics": {
    "append_dimensions": {
        "InstanceId": "${aws:InstanceId}"
    },
    "metrics_collected": {
      "disk": {
        "measurement": [
          "used_percent"
        ],
        "metrics_collection_interval": 60,
        "resources": [
          "/"
        ]
      }
    }
  }
}
After config file creation, we need to restart the Cloudwatch service.
systemctl restart amazon-cloudwatch-agentFor the configuration test, you can tail log file like below:
tail -f /opt/aws/amazon-cloudwatch-agent/logs/amazon-cloudwatch-agent.logThe expected output should be like this:
2023-04-28T12:08:03Z I! Loaded outputs: cloudwatch
2023-04-28T12:08:03Z I! Tags enabled: host=test
2023-04-28T12:08:03Z I! [agent] Config: Interval:1m0s, Quiet:false, Hostname:"test", Flush Interval:1s
2023-04-28T12:08:03Z I! [processors.ec2tagger] ec2tagger: Check EC2 Metadata.
2023-04-28T12:08:03Z I! [logagent] starting
2023-04-28T12:08:03Z I! [processors.ec2tagger] ec2tagger: EC2 tagger has started, finished initial retrieval of tags and Volumes
2023-04-28T12:08:03Z I! [processors.ec2tagger] ec2tagger: Check EC2 Metadata.
2023-04-28T12:08:03Z I! [processors.ec2tagger] ec2tagger: EC2 tagger has started, finished initial retrieval of tags and Volumes
Configure CloudWatch Alarm
While in CloudWatch Dashboard click Create Alarm button and then Select Metric button. You should see the CWAgent section button on the page.
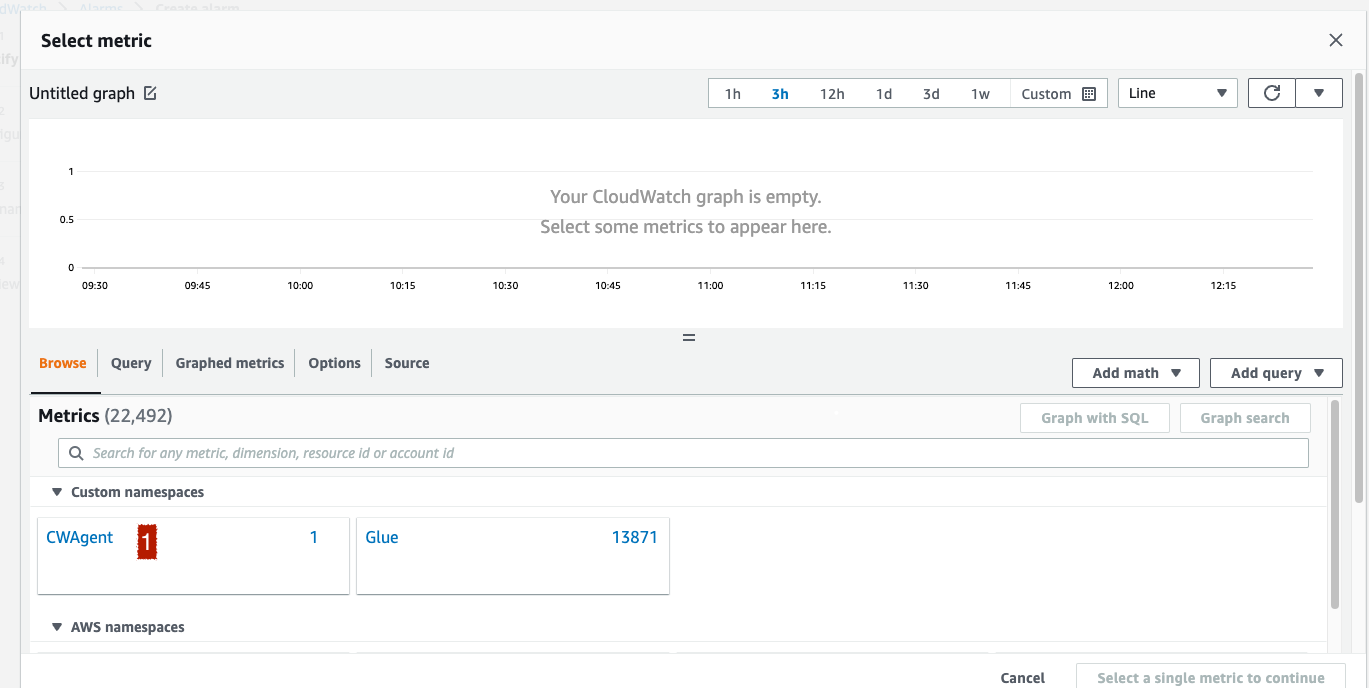
Next step, click InstanceId, device, fstype, path and select your instance from the list and click the Select Metric button.
From this point, you need to configure your disk parameters for the new alarm.
Conclusion
We have installed and configured the CloudWatch agent to our instance. We have created a disk special Alarm for it.
Now there is an alarm that monitors the disc level and we can sleep peacefully at night.
See you in the next article. 👻


